Call 'Em Like They See 'Em:
Examining Potential Umpire Bias in Major League Baseball
Introduction
Our Inspiration For The Project
Our inspiration for this project came from research done by Christopher A. Parsons, Johan Sulaeman, Michael C. Yates, and Daniel S. Hamermesh on potential racial bias exhibited by umpires in Major League Baseball in the 2004 to 2006 seasons. In short, their research stated that when the race of the umpire matched the race of the starting pitcher, the umpire was more likely to call a strike. However, they found this particular effect was only seen when there was "little scrutiny of umpires' behavior" -- that is, for example, in stadiums where there was no computerized system monitoring calls. In 2004-2006, such systems were installed in just 11 of 30 MLB stadiums, which accounted for approximately 35 percent of games played in those seasons.
We took inspiration from their methods to examine potential racial bias by umpires in the 2013 to 2015 seasons. Although we failed to find any significant effects overall, we did find that in a couple special cases, there is a subtle but notable effect on the probability that an umpire calls a strike based on whether or not he matches the pitcher on race.
Hypothesis
Our Expected Outcomes
Based on a study of the subjective racial identity of umpires and pitchers in Major League Baseball during the 2013 to 2015 seasons, we decided to examine umpires' potential bias in an attempt to corroborate or oppose the findings of Parsons et al. Our hypothesis states:
- H1: The probability that an umpire calls a striek on a called pitch is significantly effected by whether or not the umpire and pitcher match on race.
The null hypothesis, then, is:
- H0: The probability that an umpire calls a strike on a called pitch is not significantly effected by whether or not the umpire and pitcher match on race.
We tested this hypothesis for several cases:
- We examined the overall effect of whether or not umpire and pitcher match on race.
- We examined the effect of whether or not umpire and pitcher match on race, when the umpire's race is fixed. This resulted in three cases:
- When the umpire is white
- When the umpire is black
- When the umpire is hispanic
- We lumped the racial categories into a binary: white vs. nonwhite; and we examined the effect of whether or not the umpire matches the pitcher on nonwhiteness.
Data Preprocessing
Transforming and Exploring The Data
Preprocessing
We scraped every pitch of every game of the 2013, 2014, and 2015 MLB seasons from Baseball-Reference.com
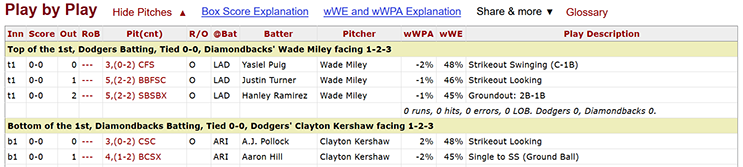
We created code to retrieve from each game, based on the structure of each game's Play by Play table:
- Home plate umpire name
- Pitch sequence
- Pitcher name for each plate appearance
- Batter name for each plate appearance
- Inning of each plate appearance
- Score of the game during each plate appearance
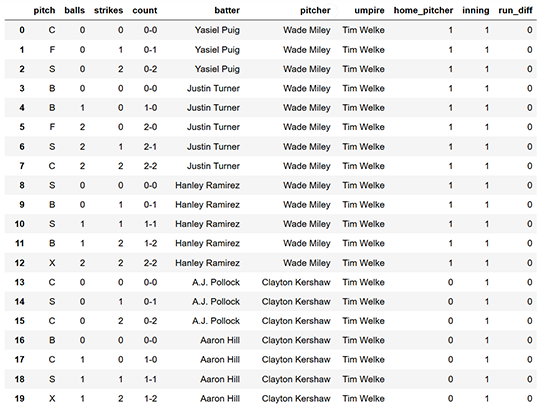
Once we scraped this data from Baseball-Reference, we transformed it to:
- Show the count of balls and strikes before each pitch
- Have only one row for each pitch
- Drop rows whose pitches were not solely dependent on the home plate umpire's discretion -- that is, we kept only rows with called strikes and called balls (not intentional balls, pitchouts, etc.). These rows corresponded with pitch code C (called strike) or B (called ball).
With each relevant pitch on its own row, we then added the race of each pitcher and umpire included in the 2013-15 game data. We compiled this data by starting with an Excel file of an MLB "player census" done by BestTickets.com. This Excel file only included players on each team's Opening Day roster for the 2014 season, so we then manually identified any pitchers not in the initial player census using a Google Image Search. Fortunately, the BestTickets file classified players into four groups: white, black, Hispanic, or Asian. These groups matched those used in the Parsons et al. study. For umpires, we again used a Google Image Search to determine each umpire's race (sorted into the same four categories as players). For pitchers and umpires whose race was not immediately obvious to the initial evaluator after a search, other group members were asked to provide a second opinion. Batter data helped separate each plate appearance (and therefore helped determine the ball-strike count for each pitch), but it was dropped once it was no longer needed.
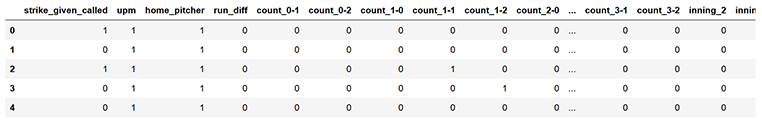
When we finally had race data for all pitchers and umpires, we merged it with the game data. From there, we were able to convert the data into indicator variables (with the exception of run_diff, which is a quantitative term) that were classified into the following columns:
strike_given_called: Whether the pitch was called a strikeupm: Whether the umpire and pitcher race matched for that pitchhome_pitcher: Whether the pitcher was pitching for the home teamrun_diff: The run difference for the pitcher's team at that point in the game; for example, if the pitcher's team led by 5 runs, this was 5, and if the team trailed by 4 runs, this was -4. If the game was tied, this was 0.count_b-s: Wherebis the number of balls in the count andsis the number of strikes in the count.inning_i: Whereiis the inning in which the pitch was thrown. If a pitch was thrown in extra innings, it was placed in theinning_9+column.
At this point, the data was ready to be tested in models.
Exploration
Before we jump into the analysis, here are some brief facts about our data set. Readers eager to see the results may jump ahead to the next two sections.
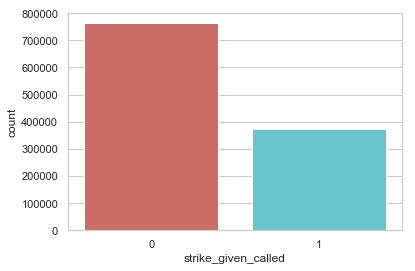
The ratio of ball vs. strike calls is 67:33.
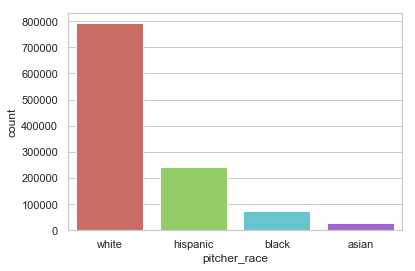
Count of pitches by pitcher race.
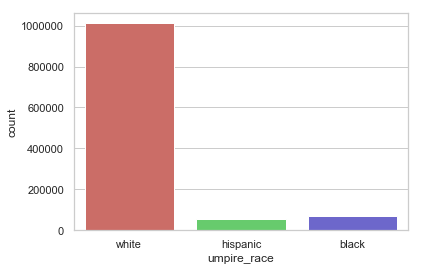
Count of pitches by umpire race
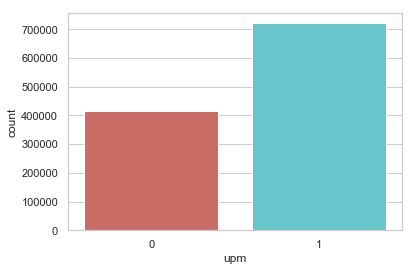
- The umpire and pitcher are more likely to be the same race than not.
- There are significantly fewer non-white pitchers and umpires than white ones.
- There are a handful of Asian pitchers but no Asian umpires.
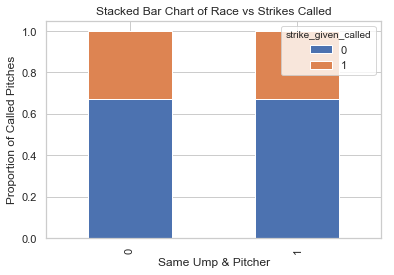
Whether the umpire and pitcher are the same race does not seem like a strong predictor for called strikes based on the visualization.
Analysis
Running Logistic Regression On Features
Our Analytical Process
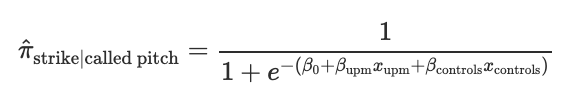
We applied a logistic regression model to evaluate the potential effects of umpire and pitcher race on whether an umpire would be more likely to call a ball or a strike. That is, we modeled the probability of an umpire calling a strike on a called pitch (π-hat) in terms of an indicator variable xupm which equals 1 if umpire and pitcher match on a racial category (UPM), 0 otherwsie, and in terms of of a vector of control variables xcontrols described in the section on data cleaning:
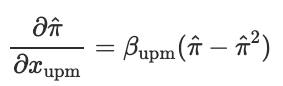
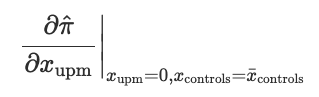
Since the coefficients of a logistic model cannot be interpreted directly, we quantified the effects of UPM on the the probability by taking the partial derivative of the probabiity estimator with respect to the indicator variable...
...and evaluating it where the indicator variable is set at baseline, and all control variables are set at their means:
After some testing with the model, we found that the significance of upm (umpire-pitcher match) is most prominent when all of the features (upm, home_pitcher, run_diff, count_b-s, and inning_i) are applied. This was an interesting find that seemed to indicate that our model was indeed picking up on a significant, if subtle, effect in certain cases, and that the control variables were serving a purpose by helping to filter out noise that would prevent the upm feature from expressing itself fully.
First, for each case we examined, we applied scikit-learn's recursive feature elimination to the appropriate subset of data to rank the features in order of significance. Then, we calculated the coefficient of upm and the p-value as control features were eliminated from the model in order of rank significance. The below graphs illustrate that the magnitude of the upm coefficients increase and the p-values decrease as features are added. This shows that the effect of upm, in some cases, subtle though it may be, is significant as we control for other variables.
Examining the Results
Overview
| Umpire Race | UPM Coefficient | UPM Effect | p-value |
|---|---|---|---|
| Black | -0.0675 | -1.43% | 0.049 |
| Nonwhite | -0.0237 | -0.50% | 0.088 |
| All | 0.0051 | +0.11% | 0.239 |
| White | 0.0053 | +0.11% | 0.275 |
| Hispanic | -0.0042 | -0.09% | 0.860 |
Coefficients and p-values
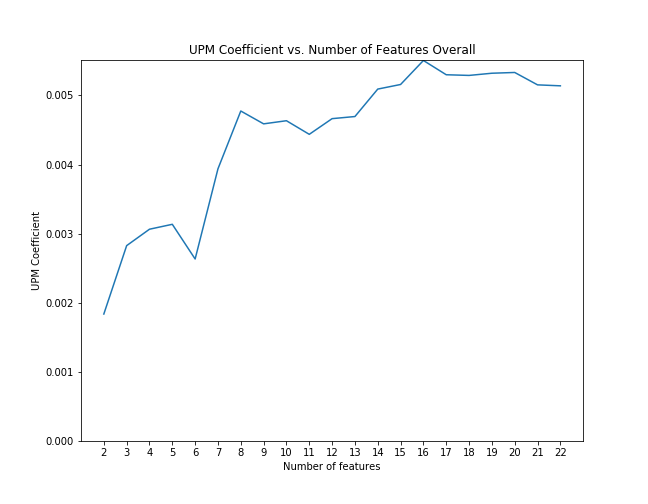
UPM coefficient with feature elimination effects overall
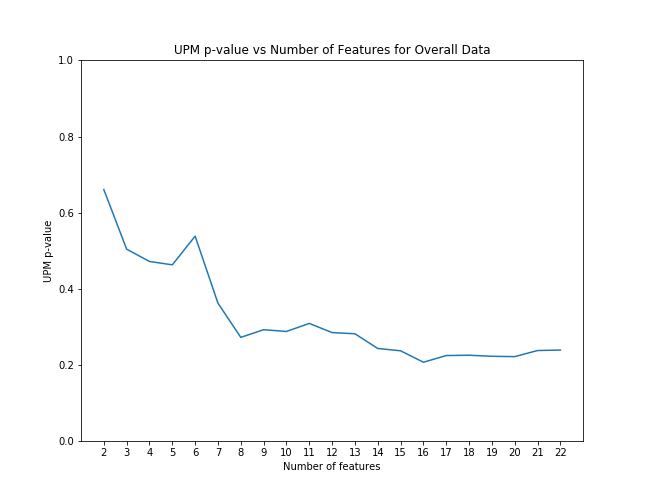
UPM p-value with feature elimination effects overall
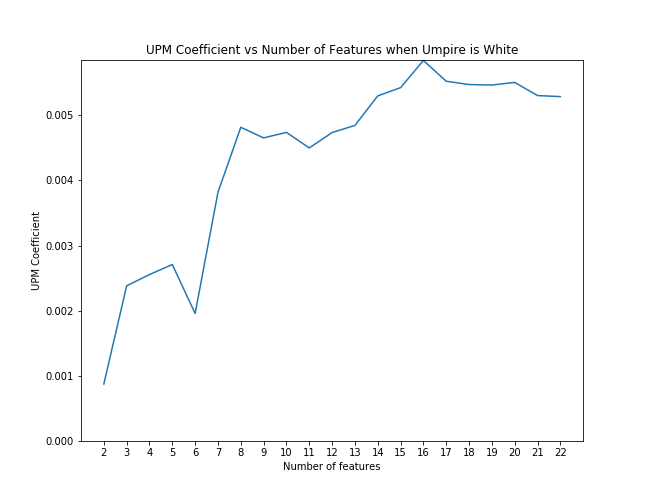
UPM coefficient with feature elimination effects when umpire is white
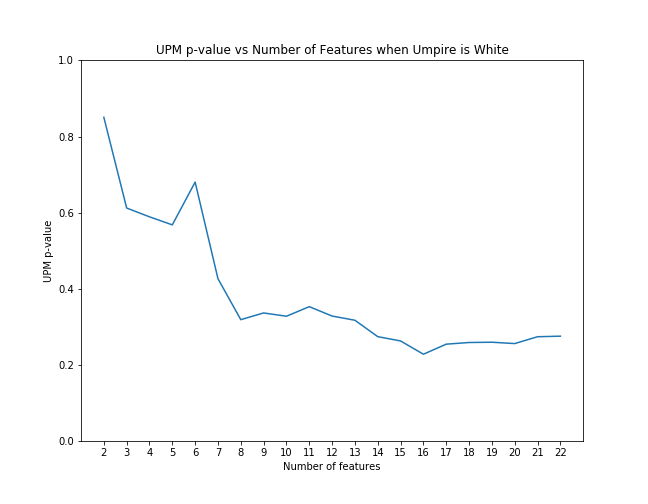
UPM p-value with feature elimination effects when umpire is white
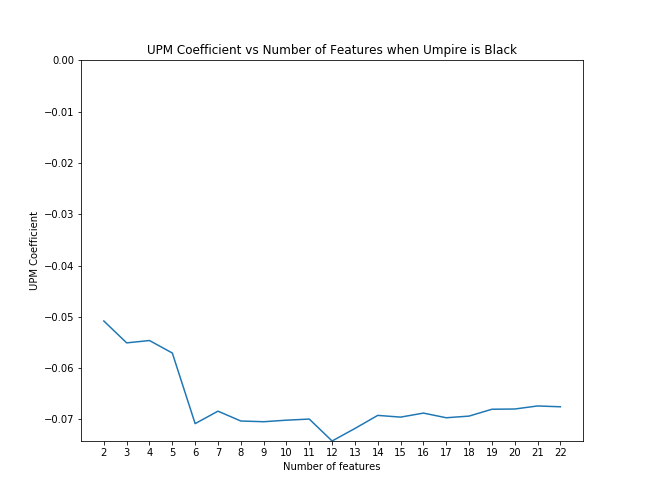
UPM coefficient with feature elimination effects when umpire is black
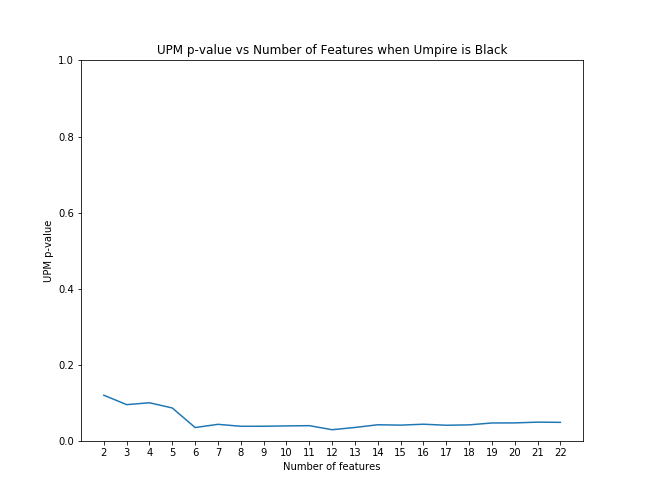
UPM p-value with feature elimination effects when umpire is black
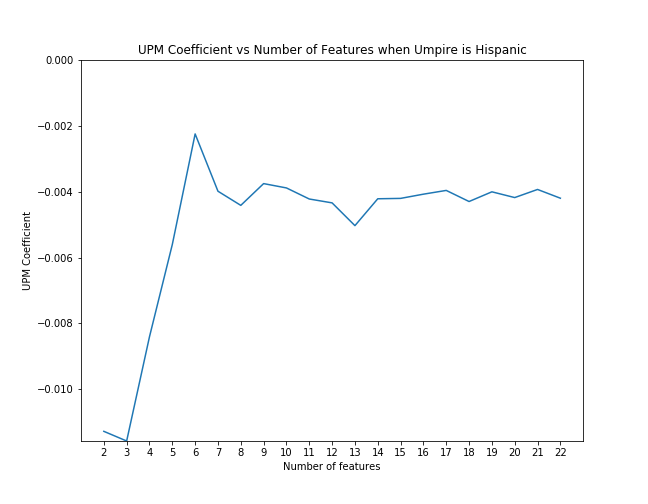
UPM coefficent with feature elimination effects when umpire is hispanic
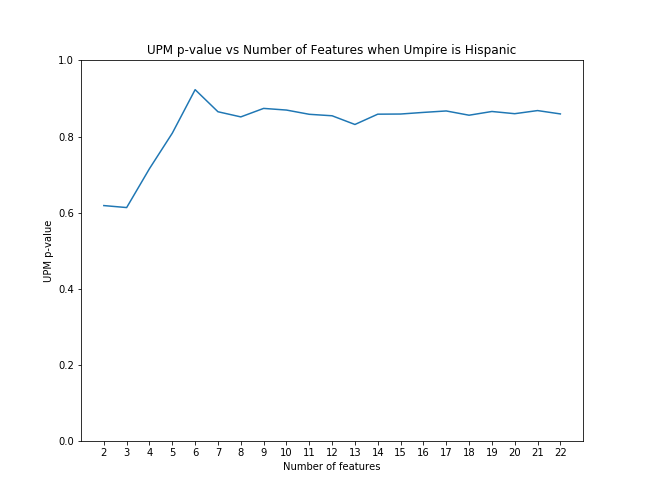
UPM p-value with feature elimination effects when umpire is hispanic
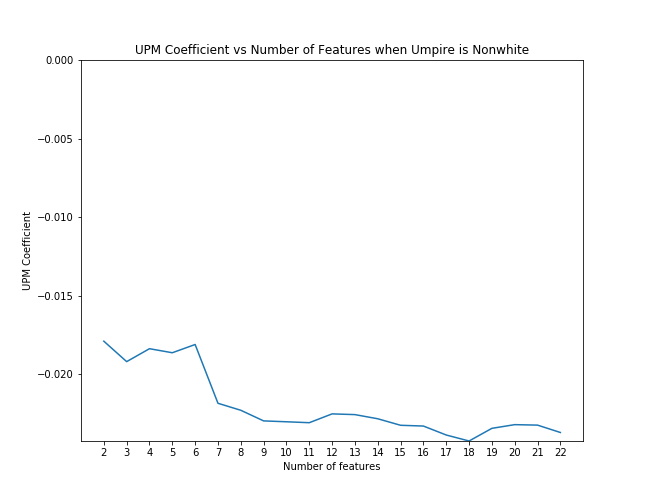
UPM coefficient with feature elimination effects when umpire is nonwhite
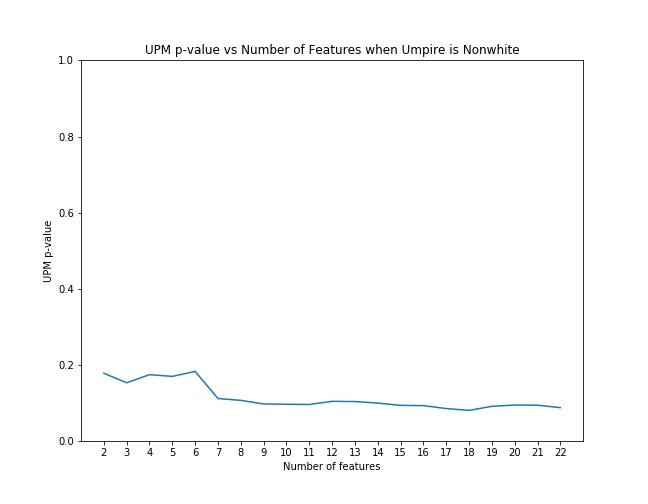
UPM p-value with feature elimination effects when umpire is nonwhite
Conclusions
Failing To Reject The Null Hypothesis
When considering the overall data, we showed similar results to the results put forth by Parsons et al. They also did not discover a significant difference in the frequency of called strikes when the race of the umpire and pitcher matched, but, using linear-probability models, they had a lower p-value (p = 0.12).
But we found opposing results to the original research when looking at black and non-white matches between umpire and pitcher. Their results showed that when umpire and pitcher matched in race, umpires were more likely to call a strike, but we found black and non-white umpire/pitcher matches to be less likely to result in a called strike.
There were some marked differences between the Parsons et al. analysis and ours. We performed a logistic regression whereas they used a linear probability model. Also, we used a different dataset covering different years (2013-2015 rather than 2004-2006). Changes in racial diversity, game rules, technology -- including electronic monitoring now in all stadiums of all games and calls -- and any number of unknown factors that we did not control for could have had an impact on the differences in our findings.